Up 378% in a Year, Does Palantir Stock Still Have 10-Bagger Potential?
/Palantir%20(PLTR)%20by%20Piotr%20Swat%20via%20Shutterstock.jpg)
Few stocks capture the imagination of traders like Palantir (PLTR). After a staggering run — up nearly 400% in the past year — the artificial intelligence (AI) software stock has recently pulled back sharply, correcting by 20% from its mid-August highs.
Now, the big question on every investor’s mind is whether it’s too late to buy PLTR – or if this AI defense stock could still be a long-term 10-bagger.
In a recent live webinar on momentum trading, John Rowland, CMT, posed this exact question to Jim Van Meerten, the author of Barchart’s popular Chart of the Day newsletter and creator of Barchart’s go-to chart templates.
Key Technical Indicators to Watch on Palantir
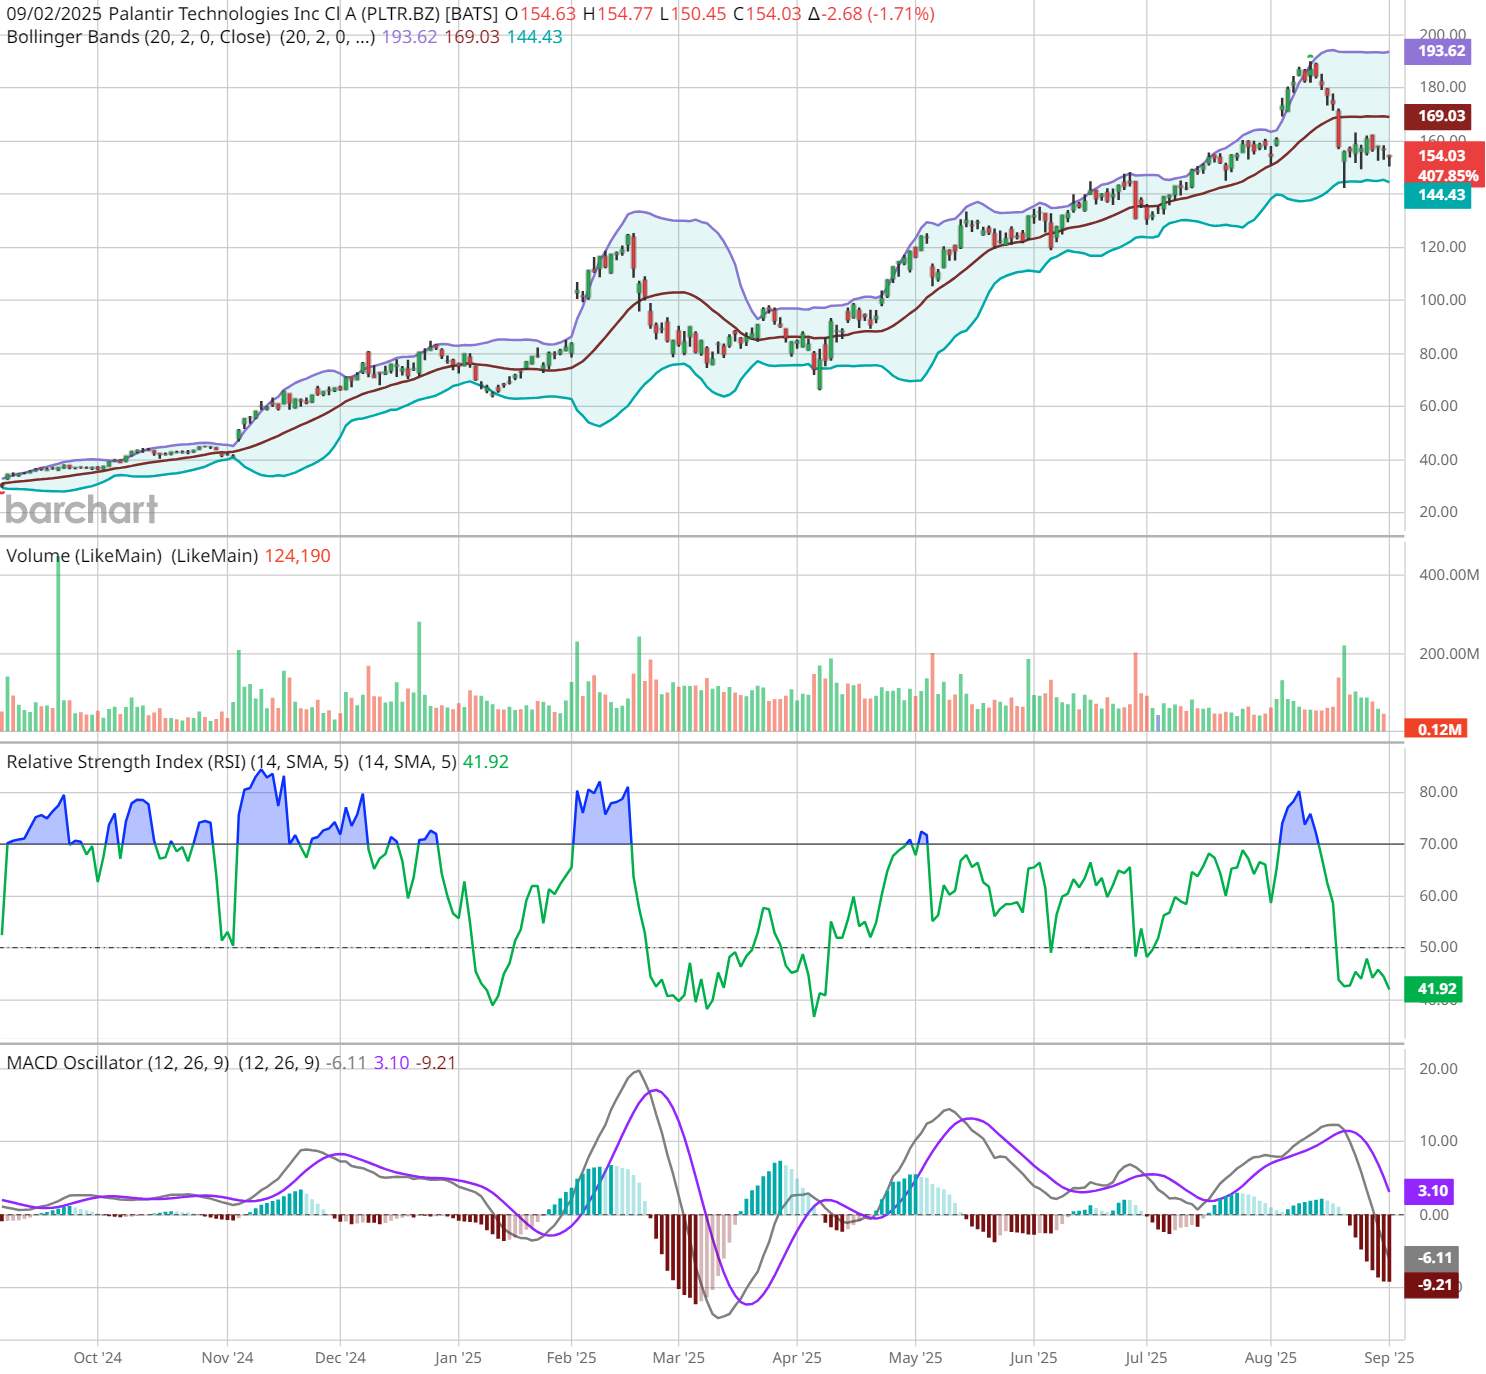
Here’s how Jim & John analyzed the PLTR technical setup as of Aug. 13, right around the time shares were peaking:
- RSI (Relative Strength Index): Palantir was firmly in overbought territory — though that’s not automatically a sell signal on its own.
- Bollinger Bands: Palantir was riding outside the bands, but widening bands show strong continuation. However, it’s not necessarily a point where new money wants to come rushing in.
- MACD: Supported the bullish momentum, though stretched.
Below is a look at PLTR as of today. The stock has corrected its overbought condition, based on the RSI around 39. Plus, shares are not only back within their Bollinger Bands, they’re also pinned below the central 20-day moving average. If this correction is similar to the one PLTR experienced in March, the current MACD reading suggests bearish momentum could be exhausted soon.
Jim’s Take on PLTR’s “10-Bagger Potential”
Jim makes an important point: 10-baggers don’t happen in a year; they’re built over three to five years. Despite the sharp rally and high-volatility pullback, Palantir may still have room to keep rising exponentially from here.
That doesn’t mean “blindly hold.” Instead:
- Use stop-losses based on your personal risk tolerance (“your tolerance for pain”).
- Watch for technical signals like a Bollinger Band reversion or a MACD reversal before adding exposure (or panic selling).
- Recognize that after such a run, “new money may not want to chase” — but long-term holders can still benefit if PLTR keeps its trajectory.
How to Trade Palantir With Barchart
If you’re watching Palantir or similar momentum names, Barchart gives you the tools to:
- Track RSI, MACD, and Bollinger Bands directly on Interactive Charts.
- Save chart templates so your preferred indicators load automatically.
- Use “Top Stocks to Own” and Barchart’s screeners to discover other momentum leaders.
- Track PLTR in watchlists and set alerts so you never miss a change in momentum.
Bottom Line
Palantir may look “long in the tooth” after its monster rally — but the data shows the stock could still be in the early innings of a bigger story. However, traders should expect higher-than-normal volatility in the short term, and stay ready to manage entries, exits, and risk.
Watch the clip now to see Jim & John’s full breakdown of the indicators they’re tracking on PLTR, and stream the live webinar on swing trading to learn how to apply momentum analysis to your own trading.
On the date of publication, Barchart Insights did not have (either directly or indirectly) positions in any of the securities mentioned in this article. All information and data in this article is solely for informational purposes. For more information please view the Barchart Disclosure Policy here.

